


 Posts
Posts


NOAA has an audio of seismic waves generated by the Toholu earthquake. Seismic P-waves are, after all, essentially the same as sound waves.
Scientists at the NOAA Vents Program at Pacific Marine Environmental Laboratory and Oregon State University heard the March 11, 2011 Honshu, Japan earthquake using a hydrophone located near the Aleutian Islands of Alaska.
Showing posts with label Tohoku. Show all posts
Showing posts with label Tohoku. Show all posts
Thursday, April 21, 2011


Monday, April 18, 2011
Tohoku quake and free oscillations
Large earthquake cause the Earth to "ring like a bell," the phenomenon of free oscillations.
There are nice animations of the different toroidal and spheroidal modes of free oscillations at this web page from Lucien Saviot of the CNRS. Note the periods of the oscillations.
The image below shows the response of the superconducting gravimeter at Metsähovi, Finland. The gravimeter is also a long period seismometer. Time runs from the day of the quake on the left to five days later on the right. Hotter colors are higher amplitudes. The scale on the left gives the frequency of oscillation, where f=0.0006 cycles/second corresponds to a period of oscillation of 28 minutes.
 Another reprsentation of some of the free oscillation data in the lower part of the frequency spectrum is shown below, from the same source.
 The lowest mode is spheroidal mode 0S2 (54 minutes). All modes decay after a few days, except the lowest radial mode (0S0) which has an expected lifetime of 3-4 months. The radial oscillation mode changes radius of the Earth with the period of 20 minutes. The observed amplitude at Metsähovi is 0.06 mm on 17.3.2011.
Free oscillations of the Earth which had been theoretically predicted were first observed after the 1960 Chile quake, the largest earthquake ever recorded.
There are nice animations of the different toroidal and spheroidal modes of free oscillations at this web page from Lucien Saviot of the CNRS. Note the periods of the oscillations.
The image below shows the response of the superconducting gravimeter at Metsähovi, Finland. The gravimeter is also a long period seismometer. Time runs from the day of the quake on the left to five days later on the right. Hotter colors are higher amplitudes. The scale on the left gives the frequency of oscillation, where f=0.0006 cycles/second corresponds to a period of oscillation of 28 minutes.


Free oscillations of the Earth which had been theoretically predicted were first observed after the 1960 Chile quake, the largest earthquake ever recorded.
Tuesday, April 5, 2011
More information on tsunami wave heights along the Japanese coast
Information from NOAA (National Oceanographic and Atmospheric Administration) on the maximum tsunami heights along the Japanese coast is a bit more subdued than the information I listed in the last post:
MARCH 11, 2011 EYEWITNESS AND INSTRUMENTAL RECORDINGSThe map below shows the near-field effects of the event including deaths, missing, maximum wave heights and arrival times at tide gauges, water heights from field surveys (data current as of March 28, 2011, will be updated weekly).
The highest wave from the March 11, 2011 tsunami was 13 meters reported by an eyewitness at Minami Sanriku town. Tide gauge recordings in Japan range from 1 to 7 meters. Three meter waves were observed by eyewitnesses in the Kuril Islands, Russia. Two meter waves were observed at tide gauges in South America, Hawaii, and the west coast of the United States. The highest wave ever recorded by an ocean-bottom sensor was measured at 1.08 meters by DART® station 21418 located 450 nautical miles northeast of Tokyo. NGDC [National Geophysical Data Center] will continue to update the historic tsunami database as eyewitness and field survey reports are received.
 |
| Source: NGDC/NOAA. Click to enlarge |
Monday, April 4, 2011
One large quake does not deserve another (at least not far away)
The Seismological Society of America has a surprisingly active Facebook page, with several posts a day.
One referred to a recent scientific article and WSJ recap on whether large, distant earthquakes were related causally and temporally. A student had in fact recently asked me whether she should study in Berkeley this summer in the wake of the Japan earthquake. The Nature Geoscience paper, Absence of remotely triggered large earthquakes beyond the mainshock region, by Tom Parsons Aaron A. Velasco, concluded that "the regional hazard of larger earthquakes is increased after a mainshock, but the global hazard is not."
This paper and related research were summarized in the Wall Street Journal, by Gautam Naik.
One referred to a recent scientific article and WSJ recap on whether large, distant earthquakes were related causally and temporally. A student had in fact recently asked me whether she should study in Berkeley this summer in the wake of the Japan earthquake. The Nature Geoscience paper, Absence of remotely triggered large earthquakes beyond the mainshock region, by Tom Parsons Aaron A. Velasco, concluded that "the regional hazard of larger earthquakes is increased after a mainshock, but the global hazard is not."
This paper and related research were summarized in the Wall Street Journal, by Gautam Naik.
 |
| From Wall Street Journal |
Tsumami heights in Japan
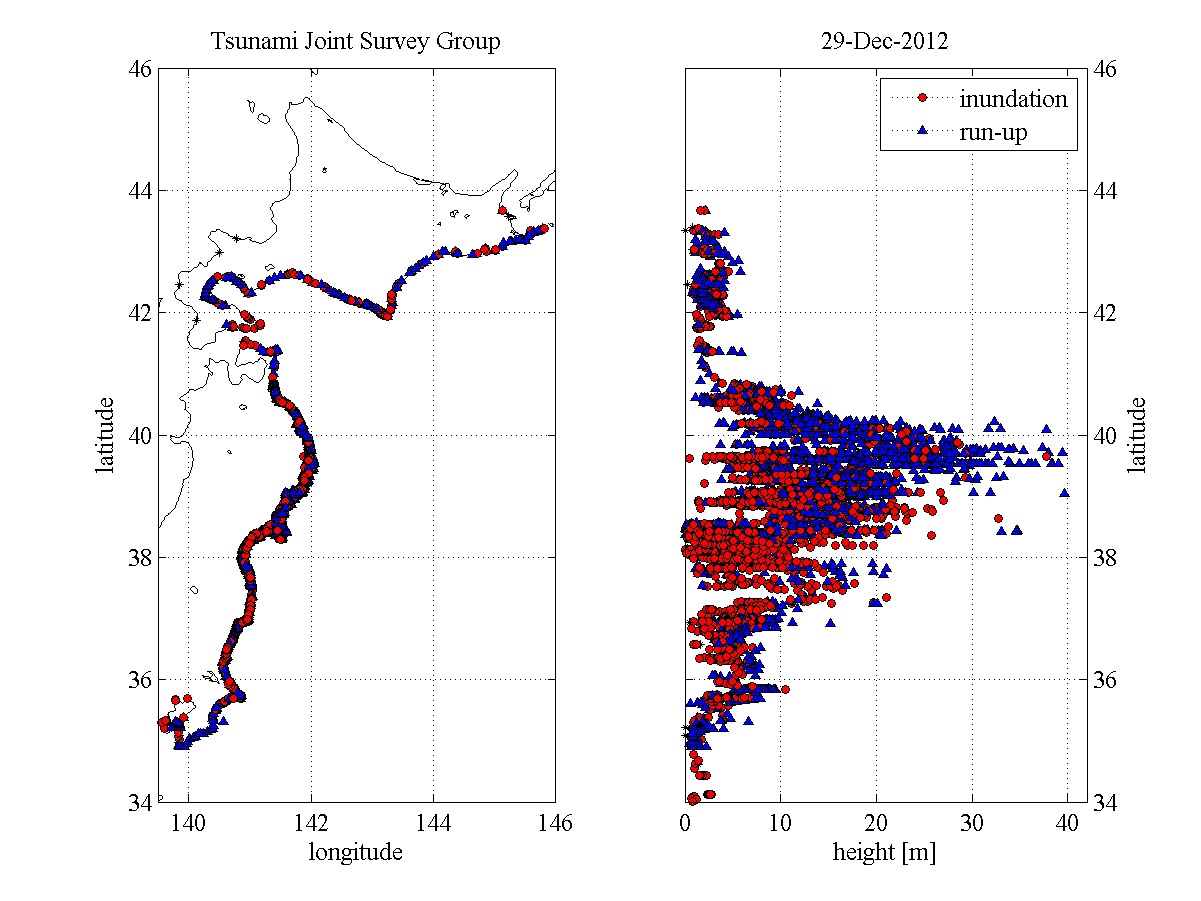
I finally found the graph I have been looking for, showing tsunami heights in Japan. These data from a preliminary report comes from yet another clearinghouse type site for tsunami data and information, the Coastal Engineering Committee of the Japan Society of Civil Engineers. The geographic location of the individual data points are not indicated, other than distance from tsunami "ground zero." Regular tidal fluctuations have not been removed. There is a lot of scatter and very high values at a distance of 0 km. The highest height shown is 30 meters (100 feet!), and there are consistent heights of over 15 meters (50 feet).
Click on the image for a more readable version.

Click on the image for a more readable version.
Sunday, April 3, 2011
Before and after photos of the Tohoku tsunami
ABC (Australian Broadcasting Corporation) has some impressive before and after photograph pairs of the tsunami damage in the Sendai region of Japan.


Friday, March 25, 2011
Groundshaking damage to buildings, Japan
So much of the damage done after the Tohoku quake resulted from the tsunami, but there was also damage of buildings due to the groundshaking in high areas that were not damaged by the tsunami. Some reports and images can be found at the Earthquake Engineering Research Institute web site.
A number of field reports on damage done in the epicentral area are given here.
A report by Shunzuke Otani on Building Damage in Sendai says:
"Miki Shoji Co, a commercial business company, reported building damage statistics by external observation along the Sendai main street; out of 175 buildings
No damage: 95
Some damage, but could be operational in short time: 66
Severe damage, need some time before use: 14
Collapse or tilting: 0
Sendai is the largest city in the affected area. A church in Mito City, Ibaragi Prefecture, suffered severe damage in the tower. A automobile ramp to the roof parking area collapse and killed three persons in automobiles; the ramp is supported by steel columns and connected to the main structure of a super market building." Images of these are shown below.
A number of field reports on damage done in the epicentral area are given here.
A report by Shunzuke Otani on Building Damage in Sendai says:
"Miki Shoji Co, a commercial business company, reported building damage statistics by external observation along the Sendai main street; out of 175 buildings
No damage: 95
Some damage, but could be operational in short time: 66
Severe damage, need some time before use: 14
Collapse or tilting: 0
Sendai is the largest city in the affected area. A church in Mito City, Ibaragi Prefecture, suffered severe damage in the tower. A automobile ramp to the roof parking area collapse and killed three persons in automobiles; the ramp is supported by steel columns and connected to the main structure of a super market building." Images of these are shown below.
 |
| Sendai church damage |
 |
| Sendai parking garage damage |
Tuesday, March 22, 2011
Mercalli intensities for the Tohoku earthquake
RMS is a provider of products, services, and expertise for the quantification and management of catastrophe risk. Below is a Mercalli intensity map produced by RMS for the Tohuku earthquake.

The Mercalli intensity map indicates damages to structures and human reactions to the event. Mercalli intensities tend to be highest near the epicenter, and decrease with distance.
[I mis-read my colors, so this paragraph is not true: In this case, the highest intensities of VI are not at the epicenter. This is presumably because of regional geology; unconsolidated rocks amplify the groundshaking, so the intensity pattern depends in part on the geology of the region.]
The Mercalli scale is described by the USGS. The description for Mercalli intensity VI is:

The Mercalli intensity map indicates damages to structures and human reactions to the event. Mercalli intensities tend to be highest near the epicenter, and decrease with distance.
[I mis-read my colors, so this paragraph is not true: In this case, the highest intensities of VI are not at the epicenter. This is presumably because of regional geology; unconsolidated rocks amplify the groundshaking, so the intensity pattern depends in part on the geology of the region.]
The Mercalli scale is described by the USGS. The description for Mercalli intensity VI is:
- V. Felt by nearly everyone; many awakened. Some dishes, windows broken. Unstable objects overturned.
- VI. Felt by all, many frightened. Some heavy furniture moved; a few instances of fallen plaster. Damage slight.
- VII. Damage negligible in buildings of good design and construction; slight to moderate in well-built ordinary structures; considerable damage in poorly built or badly designed structures; some chimneys broken. VIII. Damage slight in specially designed structures; considerable damage in ordinary substantial buildings with partial collapse. Damage great in poorly built structures. Fall of chimneys, factory stacks, columns, monuments, walls. Heavy furniture overturned.
Sunday, March 20, 2011
Fault movement for the Tohoku Japan earthquake
At times after major disasters, there is so much information, but so spread out. Harvard has set up the Japan Sendai Earthquake Portal for data sharing and exchange, with links to other relevant sites. That portal led me to the figure below.
The figure below, from Penn State, shows co-seismic slip - movement on the fault itself. The red dots are actually locations of the main earthquake and aftershocks.

The figure below, from Penn State, shows co-seismic slip - movement on the fault itself. The red dots are actually locations of the main earthquake and aftershocks.

From the figure caption: A preliminary comparison of an estimate of coseismic slip (created in collaboration with Thorne Lay at UC Santa Cruz and Hiroo Kanamori at CalTech) with the aftershocks and bathymetry. The rainbow-filled circles show the slip pattern for the Mw 9.0 earthquake. The deeper red circles are the aftershock locations.
Credit: Rupture model by C. J. Ammon, Penn State, T. Lay, UC Santa Cruz, and H. Kanamori, Caltech. Aftershock data from the US Geological Survey.
Subscribe to:
Posts (Atom)