Showing posts with label Japan. Show all posts

Thursday, April 7, 2011

Tidal gage data re-visited - tsunami wave spectra vs. distance

After the last post, I was thinking about that dominant 20-30 minute periodicity in the tidal gage responses to the tsunami waves on the west coast of the U.S., reflecting the time difference between tsunami peaks. That is one of the classic hazards with tsunamis: the wave trough may come in first, causing a beach to be emptied of water, and then when people walk out further away from shore to explore, the peak arrives half a period of time later, and people are trapped.

My visual memory of the tide gage data from the Japanese coast showed just an initial impulse. But when I looked at it again (see below, a blow-up from the last blog), one can see the initial impulse at about 30 minutes after the quake, and then a series of peaks for another 1-2 hours, at intervals of about 3-4 minutes.

Higher frequencies are attenuated more quickly with distance, as also happens for the spectral content in seismic surface waves, so by the time the waves reach the U.S. west coast, lower frequencies dominate.

Wednesday, April 6, 2011

Japan tsunami as recorded on tidal gages

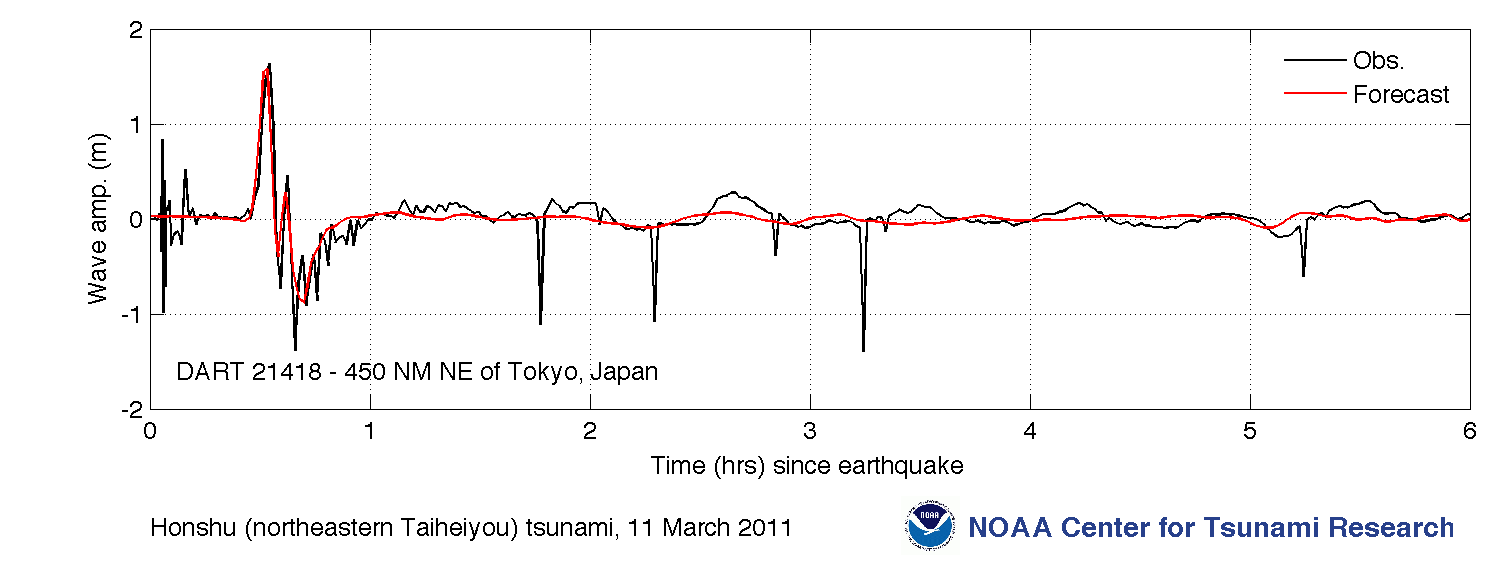
The NOAA Center for Tsunami Research provides data from sea-level tidal gages in the Pacific and along the U.S. coastline. The figure below compares data (in black) with DART (Deep-ocean Assessment and Reporting of Tsunamis) model series (red). The Tokyo record below shows a maximum peak-to-peak amplitude of over 2 meters.

Data are available for several area:
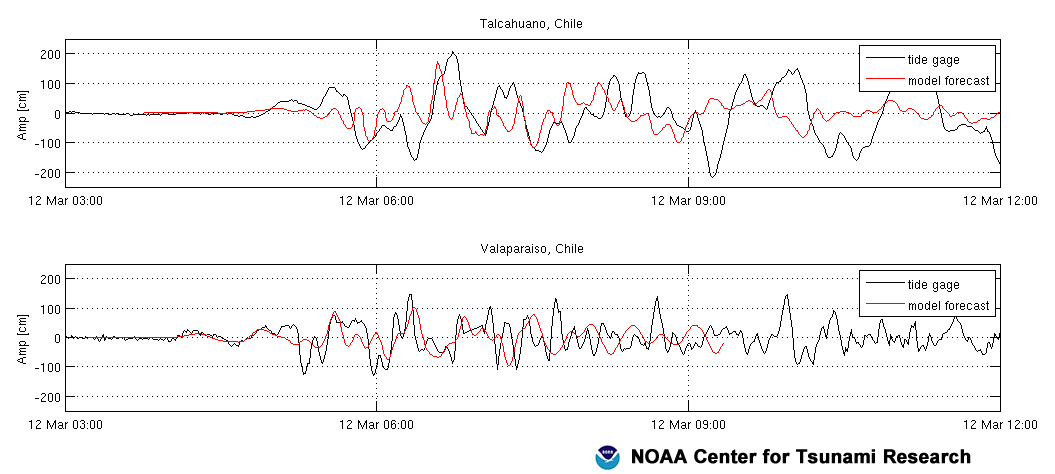
Data from the U.S West Coast, shown below, reveals an approximately 30 minute periodicity of the tsunamigenic tidal variation. Also note the 3-meter high amplitude variation at Crescent City, a location notorious for its large tsunami waves.

Tuesday, April 5, 2011

More information on tsunami wave heights along the Japanese coast

Information from NOAA (National Oceanographic and Atmospheric Administration) on the maximum tsunami heights along the Japanese coast is a bit more subdued than the information I listed in the last post:
MARCH 11, 2011 EYEWITNESS AND INSTRUMENTAL RECORDINGS
The highest wave from the March 11, 2011 tsunami was 13 meters reported by an eyewitness at Minami Sanriku town. Tide gauge recordings in Japan range from 1 to 7 meters. Three meter waves were observed by eyewitnesses in the Kuril Islands, Russia. Two meter waves were observed at tide gauges in South America, Hawaii, and the west coast of the United States. The highest wave ever recorded by an ocean-bottom sensor was measured at 1.08 meters by DART® station 21418 located 450 nautical miles northeast of Tokyo. NGDC [National Geophysical Data Center] will continue to update the historic tsunami database as eyewitness and field survey reports are received.
The map below shows the near-field effects of the event including deaths, missing, maximum wave heights and arrival times at tide gauges, water heights from field surveys (data current as of March 28, 2011, will be updated weekly).
Source: NGDC/NOAA. Click to enlarge

Monday, April 4, 2011

One large quake does not deserve another (at least not far away)

The Seismological Society of America has a surprisingly active Facebook page, with several posts a day.

One referred to a recent scientific article and WSJ recap on whether large, distant earthquakes were related causally and temporally. A student had in fact recently asked me whether she should study in Berkeley this summer in the wake of the Japan earthquake.  The Nature Geoscience paper, Absence of remotely triggered large earthquakes beyond the mainshock region, by Tom Parsons Aaron A. Velasco, concluded that "the regional hazard of larger earthquakes is increased after a mainshock, but the global hazard is not."

This paper and related research were summarized in the Wall Street Journal, by Gautam Naik.

From Wall Street Journal

Tsumami heights in Japan

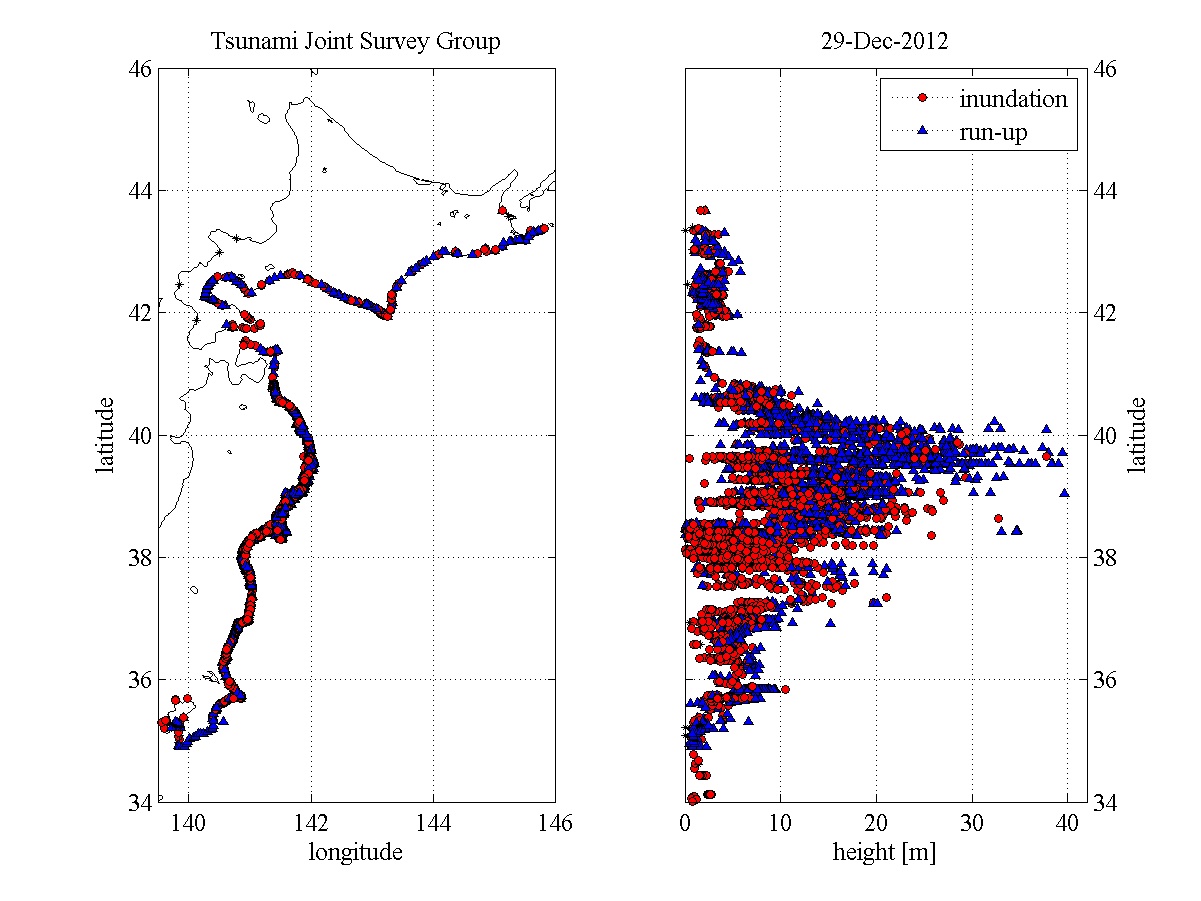
I finally found the graph I have been looking for, showing tsunami heights in Japan. These data from a preliminary report comes from yet another clearinghouse type site for tsunami data and information, the Coastal Engineering Committee of the Japan Society of Civil Engineers. The geographic  location of the individual data points are not indicated, other than distance from tsunami "ground zero."  Regular tidal fluctuations have not been removed.  There is a lot of scatter and very high values at a distance of 0 km. The highest height shown is 30 meters (100 feet!), and there are consistent heights of over 15 meters (50 feet).

Click on the image for a more readable version.

Sunday, April 3, 2011

Before and after photos of the Tohoku tsunami

ABC (Australian Broadcasting Corporation) has some impressive before and after photograph pairs of the tsunami damage in the Sendai region of Japan.

Wednesday, March 30, 2011

Japan tsunami animation - wave interference

This NOAA animation of the calculated tsunami is quite impressive:


Listen to the accompanying mini-lecture. The resulting wave patterns due to bathymetry, wave reflection and refraction are visually stunning.

This is just a computer prediction of the expected tsunami.  We'll take a look at tsunami data soon.

Tuesday, March 29, 2011

Tohoku earthquake - the tsunami

Finally, I am getting to the tsunami.

I'll be presenting some of the images that I find most impressive, although not too much in the way of photos or videos.


The figure above shows the maximum tsunami amplitudes forecast (i.e., predicted, not observed) by the NOAA (National Oceanographic and Atmospheric Administration) Center for Tsunami Research using the MOST (method of splitting tsunamis) model.

The scale saturates in Japan (I'll look for a higher resolution image for the near epicenter effects), is about 0.5 meters in Hawaii. 0.25 meters on the west coast of the U.S., and about 0.1 meters on the west coast of South America.

Friday, March 25, 2011

Groundshaking damage to buildings, Japan

So much of the damage done after the Tohoku quake resulted from the tsunami, but there was also damage of buildings due to the groundshaking in high areas that were not damaged by the tsunami. Some reports and images can be found at the Earthquake Engineering Research Institute web site.

A number of field reports on damage done in the epicentral area are given here.

A report by Shunzuke Otani on Building Damage in Sendai says:

"Miki Shoji Co, a commercial business company, reported building damage statistics by external observation along the Sendai main street; out of 175 buildings
          No damage: 95
          Some damage, but could be operational in short time: 66
          Severe damage, need some time before use: 14
          Collapse or tilting: 0
Sendai is the largest city in the affected area.  A church in Mito City, Ibaragi Prefecture, suffered severe damage in the tower. A automobile ramp to the roof parking area collapse and killed three persons in automobiles; the ramp is supported by steel columns and connected to the main structure of a super market building."  Images of these are shown below.

Sendai church damage

Sendai parking garage damage

Tuesday, March 22, 2011

Mercalli intensities for the Tohoku earthquake

RMS is a provider of products, services, and expertise for the quantification and management of catastrophe risk. Below is a Mercalli intensity map produced by RMS for the Tohuku earthquake.


The Mercalli intensity map indicates damages to structures and human reactions to the event. Mercalli intensities tend to be highest near the epicenter, and decrease with distance.

[I mis-read my colors, so this paragraph is not true: In this case, the highest intensities of VI are not at the epicenter. This is presumably because of regional geology; unconsolidated rocks amplify the groundshaking, so the intensity pattern depends in part on the geology of the region.]

The Mercalli scale is described by the USGS. The description for Mercalli intensity VI is:
V. Felt by nearly everyone; many awakened. Some dishes, windows broken. Unstable objects overturned.
VI. Felt by all, many frightened. Some heavy furniture moved; a few instances of fallen plaster. Damage slight.
VII. Damage negligible in buildings of good design and construction; slight to moderate in well-built ordinary structures; considerable damage in poorly built or badly designed structures; some chimneys broken. VIII. Damage slight in specially designed structures; considerable damage in ordinary substantial buildings with partial collapse. Damage great in poorly built structures. Fall of chimneys, factory stacks, columns, monuments, walls. Heavy furniture overturned.
Because of the earthquake-resistant building construction in Japan, the groundshaking of the quake did not do much damage. The tsunami was to blame for most of the destruction.

Monday, March 21, 2011

How much did the rest of Japan move?

This map from JPL and NASA based on gps measurements shows movements up to 5 meters (about 15 feet) on the mainland itself.


Sunday, March 20, 2011

Fault movement for the Tohoku Japan earthquake

At times after major disasters, there is so much information, but so spread out. Harvard has set up the Japan Sendai Earthquake Portal for data sharing and exchange, with links to other relevant sites. That portal led me to the figure below.

The figure below, from Penn State, shows co-seismic slip - movement on the fault itself. The red dots are actually locations of the main earthquake and aftershocks.

From the figure caption: A preliminary comparison of an estimate of coseismic slip (created in collaboration with Thorne Lay at UC Santa Cruz and Hiroo Kanamori at CalTech) with the aftershocks and bathymetry. The rainbow-filled circles show the slip pattern for the Mw 9.0 earthquake. The deeper red circles are the aftershock locations.

Credit: Rupture model by C. J. Ammon, Penn State, T. Lay, UC Santa Cruz, and H. Kanamori, Caltech. Aftershock data from the US Geological Survey.

Thursday, March 17, 2011

Thrust faulting for the Japan earthquake

The images below are taking from a USGS poster on the Japanese earthquake.

As in the last post, the balloon diagrams are "fault plane solutions." These are based on the P-waves arriving at different seismic stations, and whether the first pulse of energy is a compression or a dilatation (stretching apart). These patterns reveal the orientation of the fault on which the earthquake occurs, and the nature of the faulting. Note that in the top figure, the boundary between the black and white portions of the balloon diagrams are parallel to the major plate boundary between the Pacific plate (to the east) and the Eurasian pate (to the west). This tells us what the strike of the fault is.  Also, the pattern of black (compressions) and white (dilatations) shown corresponds to a thrust fault occurring on a fault plane shallowly dipping to the northwest, as suggested by the pattern of earthquake locations shown on the second diagram. Thus, we can use seismic waves to tell us what kind of faulting of the Earth's crust occurred 25 km below the surface, even though no one is there to directly observe it.


Slip of almost 50 meters for Japan quake

The figure below from the University of California at Santa Barbara shows a maximum slip of almost 50 meters (165 feet) on the fault accompanying the Japan earthquake. The star shows the epicenter of the main shock. Red dots are the aftershocks (M>3). The black line indicates the major plate boundary


Oher interesting resources for this event, some of which I will return to, are referred to from the IRIS web page.

Wednesday, March 16, 2011

Animation of Japan foreshocks-main shock-aftershocks

This animation from YouTube showns the main shock at 1:16, with both preceding foreshocks and succeeding aftershocks. Because the energy release increases by a factor of 27.5 with each step in magnitude, most of the energy is released by the main shock.

Beware if you are in the library: music is included.


 You can get a sense of all that activity by looking at the lists at the USGS/NEIC website.

Tuesday, March 15, 2011

Japan quake, some of the early news

Here were some of the early news stories that impressed my geophysics students Peter Rippberger, Hannah Rosenberg, and Matt Slowinksi:

http://www.bbc.co.uk/news/world-middle-east-12307698
Up to date coverage of the diasster in Japan from BBC news report.

http://www.npr.org/?refresh=true
One of the worst effects of earthquakes are the tsunamis caused by the quake, check out the link to learn more.

http://www.affordablecebu.com/load/news/japan_earthquake_and_tsunami_pictures_march_11_2011/37-1-0-663
Look at the link to see pictures from the devastating event.

http://www.youtube.com/watch?v=DePXcKeaHZ4&amp
Look at this live footage of how quickly the flood spreads.

http://www.youtube.com/watch?v=j3fUqdGXLbM&playnext=1&list=PL0870831CE43351E1
Here is a video from one of the residents of Japan while the Earthquake was occuring.

Monday, March 14, 2011

Japan earthquake - seismograms

My geophysics students Eamon Hall, Conor Neal, and Stacey Sosenko tracked down this seismogram from the Australian seismograph network:

Seismograms from the western Australia network of seismograms shows the initial pulse a little more than 10 minutes after the main quake, as shown in the figure below.
 
The Franklin & Marshall seismograph is located about 93 degrees away from the focus and felt the quake about 13 minutes after it struck, as expected.  The seismogram also shows up two  aftershocks later in the day.


Or, check out some more seismograms using the Rapid Earthquake Viewer.

Japan 8.9 quake - the source

On Friday, the morning after the devastating earthquake in Japan, I had my geophysics students compile some information about the quake.

Elvis Andino, Stephanie Douglas, and Andrew Tsang looked at the source parameter. They found:

The epicenter occurred at 38.322°N, 142.369°E on the Japan Trench subduction zone, where the Pacific plate is subducting beneath the Eurasian plate.  The epicenter was 373 km NE of Tokyo. The earthquake focus was about 24 km below the sea floor.


As shown below in the fault plane solution, the earthquake exhibited thrust faulting, consistent with its location along a subduction zone. The NE-SW strike of the fault plane is parallel with the orientation of the plate boundary shown above.


It had a magnitude of 8.9, putting it 5th on the USGS's list of largest earthquakes since 1900, right before the 2010 Chile earthquake,

Large foreshocks preceded the main shock over the previous two days, including a M7.2 quake about 40 km from the epicenter of the big earthquake.

Because Japan is partially surrounded by fault zones, it has had many earthquakes in its history. These have mostly been shallow quakes. The last major earthquake on the same fault was in 2005, a M7.0

Sunday, February 28, 2010

Tsunami warning in Japan from Chile quake

Tsunamis can travel across the ocean at 1000 km/hr (600 mph), although they are barely felt until the wave amplitude builds up when the wave feels ocean bottom near the coast.  But given the 10,000 miles across the ocean from Chile to Japan (here is a nice Java applet to calculate geographic distances), that's 20 hours!

Here was the warning put out by the Japan Meteorological Agency:

Tsunami Warning/Advisory
Issued at 09:33 JST 28 Feb 2010

******************Headline******************
Major Tsunami and Tsunami have been issued.
  PACIFIC COAST OF TOHOKU
  PACIFIC COAST OF HOKKAIDO
  JAPAN SEA COAST OF AOMORI PREF.
  KANTO
  IZU/OGASAWARA ISLANDS
  TOKAI
  PACIFIC COAST OF KINKI/SHIKOKU
  OKAYAMA PREF.
  ARIAKE SEA AND YATSUSHIRO SEA
  EASTERN PART OF KYUSHU
  KAGOSHIMA PREF.

Evacuate from the seashore immediately to the safe places near the above coasts.
Tsunami attentions are in effect at some of the other coasts now.

***********About Tsunami Forecast************

Tsunami height is expected to be 3 meters or more, Keep careful watch on tsunamis.

Tsunami height is expected to be up to 2 meters, Keep watch on tsunamis.

Tsunami height is expected to be about 0.5 meters, Pay attention to tsunamis.

Friday, October 23, 2009

Earthquake early warning systems


There was an  interesting story on NPR a few days ago about the development of s seismic early warning system for California. Note that this is not earthquake forecasting or prediction, which might give days to years of warning about the possibility of a quake. Nor is it a tsunami warning system, which can give hours of warning that water waves may arrive across the ocean after an earthquake has already occurred.

Earthquake early warning systems use the travel time of seismic waves (around 5 miles per second!) to give a few seconds of warning before they arrive. So, in Japan, high-speed Shinkansen trains might be automatically slowed. Elevators could be forced to stop at the next floor.  Or, upon hearing sirens in the U.S. after the waves were sensed, you might have time to get below your desk. (Brings back memories from my youth of duck and cover drills).

As the article tells us, this effort is probably less effective than good earthquake planning and engineering, but a lot less costly then completely retrofitting San Francisco and Los Angeles.